
|
Social Security Finances
Correlations with Unemployment Technical |

|
Social Security Needs "Unemployment Insurance"
| If this is your first visit to the concept of the strong correlation between unemployment and Social Security finances, and the consequent usefulness of "unemployment insurance" to render Social Security permanently solvent, please see the accompanying introductory page, where the case is fully developed for the correlation with the primary financial series, the Net Trust Fund Increase (NTFI). This page provides a similar analysis of the other summary financial series shown in the Trustees annual report for 2010, Table IV.A4. |
A brief recap of the importance of unemployment -- As illustrated in this study, unemployment affects Social Security very directly, although some Social Security staff members have told us there is no significant correlation. However, this would have less significance were it not for the evidence provided by the Social Security Trustees that, at a reasonable low level of unemployment (4.5%), the Trust Fund is indefinitely solvent. In each of their reports over the last dozen years, they have provided a three-projection chart of the Trust Fund's asset level (see here for a display of these). The 2010 version:

shows three projections based on various sets of economic/demographic assumptions (Table II.C.1) -- the "Low-Cost" (I), "Intermediate" (2), and "High-Cost" (III) scenarios. One of the significant variables in these is the Unemployment Rate, the assumptions for which are:
| I | Low-cost | 4.5% |
| II | Intermediate | 5.5% |
| III | High-cost | 6.5% |
Obviously, one of these three scenarios (4.5%) has long term viability, yet it is absent from virtually all public discourse. Only the soon-to-be-bankrupt "Intermediate (II)" scenario is discussed. These rates are being assumed for a 75-year period.
(Note: The idea that 4.5% unemployment is inherently inflationary is dealt with historically in the introductory paper.)
Given the Trustees' obvservation, a correlation between Social Security finances and the unemployment rate that would provide a measurable method for supplementing the NTFI up to its 4.5% unemployment level -- i.e. provide it with "unemployment insurance" -- would be the most functional way of maintaining its future solvency. This is laid out clearly in the introductory document.
Demonstrating the correlation -- The introductory document demonstrates the unemployment correlation for the NTFI using a date-ordered two-variable (DO2V) plot. This correlation is of primary interest for establishing a supplement in time of high-unemployment because the NTFI is the ultimately-measured inflow into the Trust Fund. Whether the components that make up this net inflow -- Trust Fund Income (and how it is affected by its component of interest on the Trust Fund), and Cost -- are as well-correlated is of secondary importance. They are examined in ths document, using the same approach used for the NTFI in the introductory document:The resulting regression lines for these periods are shown on the regression DO2Vs, with periods of "recession" (increasing unemployment) shown in dashed red, and periods of "recovery" (decreasing unemployment) in solid green. The slope and the R-squared correlation coefficient value for each line are shown both in the chart and tabulated in the regression values table below, which is color coded to indicate the quality of the various correlations, some of which are excellent, some definitely not.
There are periods of non-correlation and transitions between periods of good correlation. Determining the policy and/or demographic changes that have caused these periods is of considerable importance if policy use is to be made of the otherwise clear correlation. Those who wish to evaluate different periods or pursue this issue further may find useful the spreadsheet used in this study.
In addition to the regression-line charts, the same charts are shown without regression lines to allow the viewer to make his/her own decisions about possibly different correlation periods. Each chart is available in the compact version shown on this page, with links to both a separately displayable full-size clearer screen shot, and a full-size printable PDF file. There is also a link, where applicable, to an analytical endnote about the chart.
|
Date-Ordered Two-Variable Plots
(see below for superimposed regressions)
| Net Trust Fund Increase notes |
Including Interest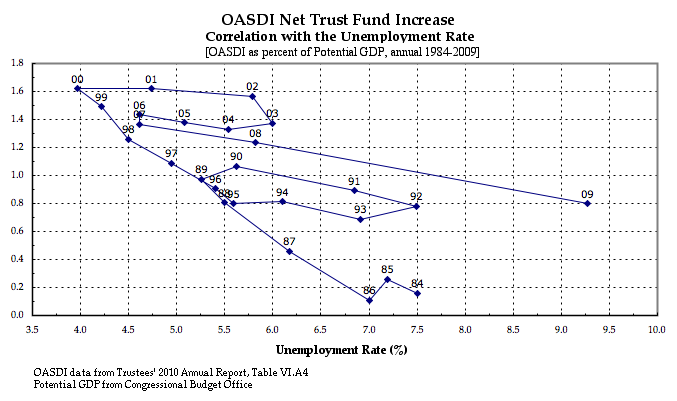 full screenshot printable pdf |
Excluding Interest full screenshot printable pdf |
| Trust Fund Income notes |
Including Interest full screenshot printable pdf |
Excluding Interest full screenshot printable pdf |
| Trust Fund Cost and Interest Income |
Trust Fund Cost full screenshot printable pdf notes |
Trust Fund Interest Income full screenshot printable pdf notes |
Date-Ordered Two-Variable Plots with Regression Lines
(see above for plain diagrams;
see also below for table of regression values)
| Net Trust Fund Increase (w/regressions) |
Including Interest full screenshot printable pdf notes |
Excluding Interest full screenshot printable pdf notes |
| Trust Fund Income (w/regressions) |
Including Interest full screenshot printable pdf |
Excluding Interest full screenshot printable pdf notes |
| Trust Fund Cost (w/regressions) |
 full screenshot printable pdf notes |
As might be expected, there is no demonstrable correlation between unemployment and Trust Fund Interest Income -- though one might expect it long-term between unemployment and the change in Interest Income notes |
Regression Coefficients and R-squared Fit Values
(see above for actual regression lines)
|
Period Color Codes Recessions Recoveries |
R-squared Value Color Codes
|
| Year Interval |
Net Trust Fund Increase incl. Interest |
Net Trust Fund Increase excl. Interest |
Trust Fund Income incl. Interest |
Trust Fund Income excl. Interest |
Total Cost | |||||
| Slope | R2 | Slope | R2 | Slope | R2 | Slope | R2 | Slope | R2 | |
| 86-89 | -0.4195 | 0.9932 | -0.4168 | 0.9996 | -0.2847 | 0.8355 | -0.2100 | 0.8103 | -0.0764 | 0.9195 |
| 90-92 | -0.1504 | 0.9959 | -0.2016 | 0.9961 | -0.0638 | 0.9990 | -0.1151 | 0.9999 | -0.0865 | 0.9823 |
| 95-00 | -0.4913 | 0.9834 | -0.3716 | 0.9834 | -0.3867 | 0.9915 | -0.2670 | 0.9951 | -0.1045 | 0.9084 |
| 00-02 | -0.0329 | 0.7838 | -0.0753 | 0.9804 | -0.0455 | 0.9385 | -0.0879 | 0.9968 | -0.0126 | 0.8334 |
| 04-06 | -0.1169 | 0.9987 | -0.0959 | 0.9904 | -0.0581 | 0.8985 | -0.0371 | 0.5908 | -0.0588 | 0.8926 |
| 07-09 | -0.1221 | 0.9994 | -0.1189 | 0.9999 | -0.0661 | 0.9827 | -0.0629 | 0.9719 | -0.0560 | 0.9570 |
Net Trust Fund Increase (back)
The two charts -- with and without interest -- are presented on the same scale to show the influence of interest income on the Trust Fund. But for the interest income, the Trust Fund would have ceased growing in 2009. The standard depression dynamic of reduced contributions and increased costs are will eventually be combined with lowered interest rates to create a perfect storm for damaging Social security.
Trust Fund Income (back)
This chart shows to some extent the supportive effect of interest on the income side. Because the vertical axis starts at 4.5%, the effect appears greater than it is in reality, but starting the axis at 0% would have jammed the chart into a smaller vertical space, making it much harder to read.
Cost (back)
The general zig-zag and/or curved nature of the line segments in this DO2V suggests that regression values will be relatively poor.
Interest Income (back)
The inexorable upward progression of the series is to be expected as long as the Trust Fund assets keep increasing. The zig-zags are simply the reflection of changing unemployment rates. The fact that the distance between the zig-zagged levels has been significantly reduced since 2003 is a reflection of the decline in interest rates.
As noted in the "excluding interest" charts, interest has become, and will be for the forseeable future, a major component of income. It is, at present, the only component keeping the asset level from declining, and the effects of the continued depression on income and cost will inevitably overwhelm its influence and cause it, in turn, to decline. One effective way to avoid that inevitability would be to adopt the concept of "unemployment insurance" for Social Security introduced here.
Regression: Net Increase including Interest (back)
This chart provides the bottom line basis for this proposal of unemployment insurance for Social Security. The various periods, although in many cases short, show a very close correlation. What happens between them is something that deserves a lot more research, given the seriousness of the problem being addressed here.
Regression: Net Increase excluding Interest (back)
The non-regression version of this chart retained the scale of the corresponding "including Interest" chart to show how significant interest income is to the Trust Fund. In this case, using the same scale crushes the lines down to where it is difficult to see the patterns, so a larger scale is used.
Regression: Income including Interest (back)
As with the analogous NTFI chart, this scale has been expanded to spread the chart out in order to make the time path and reqression lines clearer.
Regression: Cost (back)
As noted in the non-regression version of this chart, irregular lines suggest the likelihood of poor regression values, which is, in fact, the case. But the somewhat jagged lines nevertheless for the most part have a characteristic slope, which the line colors make even clearer -- Social Security's costs go up in recessions, and down in recoveries. Forced early retirements is obviously part of it, but perhaps also increased disability payments as the stress of layoff-induced overtime takes a toll as well.
Regression: Interest Income (back)
One indication of non-correlation is a horizontal (or vertical) regression line. These lines are close to horizontal, as shown in the non-regression chart; they only rise because the Trust Fund assets have been increasing, providing more principal for interest to develop. Another non-correlation indication is the equal preponderance of positive and negative slopes, caused by the zig-zagging of unemployment while the amount of interest rises continually.
|
Written: December 11, 2010
Posted: August 26, 2011 Last revised: October 2, 2011 |
|